A Seat at the Picnic Table: The Impact of Redlining on Parks and Where We Go From Here

Parks. We’ve all been to one. We walk to them, bike to them — but some may require a 30-minute drive. Once you get there, you might play basketball, baseball, or tennis — but some may not have an activity court. You might decide to go and have a picnic — but some parks don’t have picnic tables, so you find somewhere else to go.
Some. Some. Sum?
What is the summation for a park to have green space, courts, walkability, and consistent maintenance? Sometimes the cost is the community, income, and education you have.
Park equity means everyone, regardless of where they live, should have access to safe, healthy, and well-maintained public spaces. Park access is a key social determinant of health, influencing rates of chronic disease, mental well-being, and even life expectancy.
However, park access isn’t equal. Due to decades of redlining and disinvestment, many low-income communities and communities of color have fewer parks, and the ones they do have are often neglected. Redlining in particular shaped which neighborhoods received investments in public infrastructure, including parks. As a result, wealthier, whiter areas had access to the funds needed to build nicer parks and maintain upkeep. As the wealth gap widens, parks serve as a visible symbol of this inequity.
What We See on the Ground
Access to standard-quality parks is proven to improve health and create jobs. People living near green space have lower rates of diabetes and cardiovascular death, and parks contribute over $201 billion and 1.1 million jobs to the economy annually. But not all communities have access.
In lower-income, majority-BIPOC neighborhoods, there is 44% less park acreage. Existing parks in these communities often suffer from neglect and underuse due to egregious safety and maintenance issues.
At Greenlining the Block, we work with 24 community-based infrastructure developers in nine metro areas nationally — including Oakland, Stockton, and Eastern LA County. Across these majority-BIPOC neighborhoods, we see the same pattern: a lack of green space, emptied pools, shuttered community centers, crumbling playgrounds, and rising safety concerns. The parks that do exist are often at the end of their life — deteriorated or closed.
Often, cities can fund the construction of new parks, but can’t raise the revenue to maintain them. Bathrooms go uncleaned. Courts become unusable. And without this basic maintenance, parks lose their impact. New parks become old parks and then become unmaintained. It’s an endless cycle.
This is because ongoing maintenance relies on local general funds, where parks are routinely deprioritized behind fire and police departments despite also being a public safety service.
The State of California already helps maintain locally-owned schools, libraries, and wildfire-prone land. It should do the same for parks in the urban working-class communities of color who need them most.
The heart of the problem is everyone wants ribbon cuttings, but no one wants to pay for long-term maintenance. However, this short-sightedness can end up costing even more in the long run. Maintaining a 15-acre, urban SF Bay Area park costs about $225,000 a year, while letting it decay only to have to rebuild it could cost up to $15 million — over 3x more when spread over time.
The math is clear: year-by-year maintenance is cheaper, sustains jobs — often unionized — and ensures parks stay open, safe, and welcoming. But in low-income, BIPOC communities, parks are the first to crumble and the last to be repaired, and no state policy has stepped in to stop that cycle.
Creative Solutions
Partners throughout California have tried to secure equitable maintenance and funding for parks. One solution is stewardship programs that pair cities with nonprofits that work to keep parks maintained. A stewardship program is a strategic, ongoing process of building and maintaining relationships with donors to ensure their continued engagement and support. It involves acknowledging contributions, demonstrating impact, and fostering a sense of connection between the nonprofit and its supporters.
Mapping out Need
We know not all parks are created (and funded) equally. So how should legislators and advocates determine which parks to prioritize?
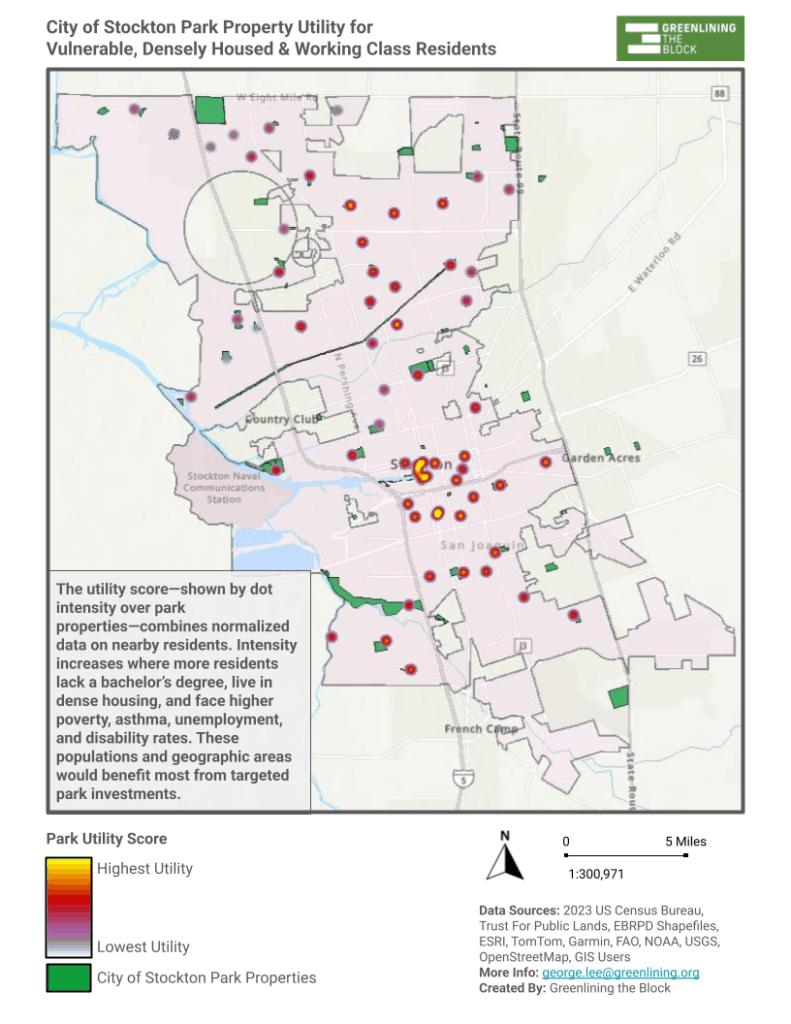
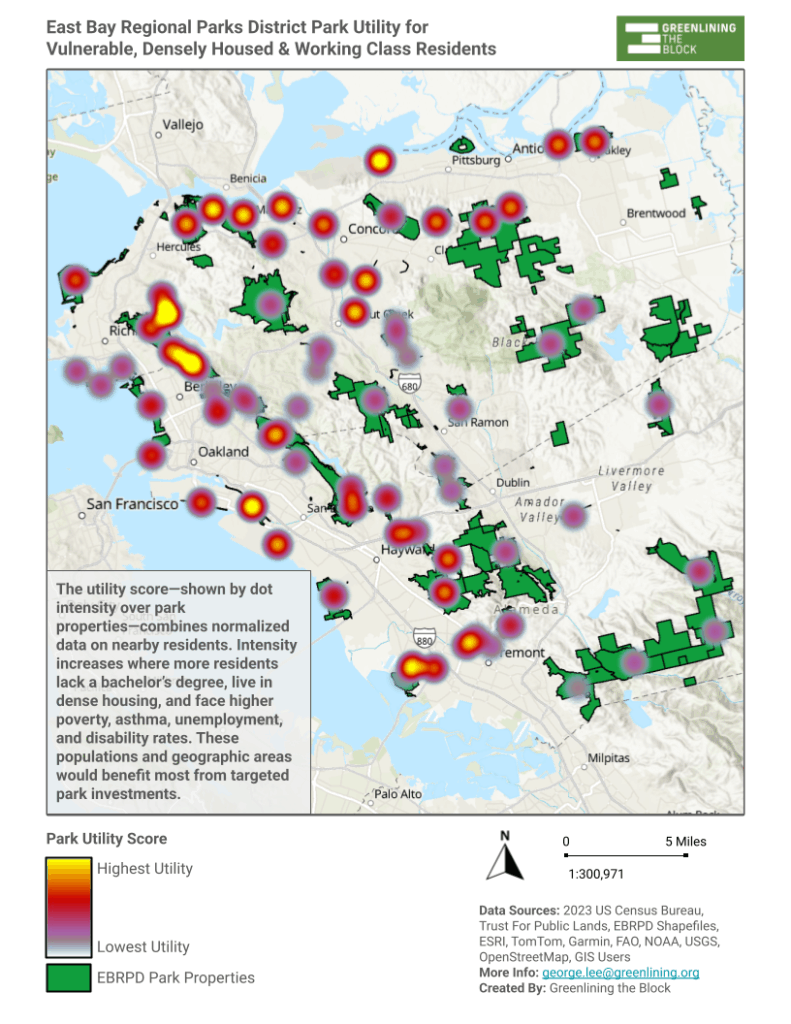
To better understand which parks need the most support, the Community Policy Lab at Greenlining conducted a geospatial data analysis of parks in the East Bay Regional Park District and the City of Stockton. We analyzed population, vulnerability (including health indicators), and economic data to create a utility score — a measure of which parks are in highest need of support. The higher the score the higher the need. We utilized heatmaps to visualize parks in terms of their necessity to populations that are considered to have health vulnerability, working-class, and live in densely populated areas.

Let’s take a look at Stockton.
North Stockton, home to typically wealthier and whiter families, has cooler temperatures — up to 15 degrees cooler than surrounding areas thanks to better tree coverage — and better park maintenance.
South Stockton, home to more communities of color and lower-income families, is hotter and has fewer functioning parks. The parks with the highest utility scores — Lafayette Park, Liberty Park, and King Plaza — are all in South Stockton. Despite their high importance to the surrounding communities, they are undermaintained and below city standards for similar amenities in the north.

Next we looked at the parks in our own backyard, the East Bay Regional Park District. EBRPD spans more than 73 municipalities across urban, rural, and suburban landscapes. EBRPD owns over 125,000 acres, 1,330 miles of trail, and manages 55 miles of shoreline, with park maintenance mostly funded through property and parcel taxes. Although less geographically linear, the pattern in utility scores and demographics still repeats.
Urban, working-class neighborhoods within EBRPD pay plenty in taxes, but still see less investment in park upkeep than nearby areas. Why? Because the Bay Area continues to be shaped by its heavily segregated and redlined past.
The East Bay was divided into “the flatlands” and “the hills.” Areas bordering the coast were targeted for industrial infrastructure, designating them as work zones. Wealthier, whiter communities settled in the inner bay, shielded by less desirable areas by towering hills. Meanwhile, Black and Brown residents were driven to the outer industrial edges.
Today, EBRPD hot spots for higher utility scores are MLK Shoreline, Carquinez Strait, and Martinez Shoreline — all on the fringes of East Bay, in areas with higher populations of low-income communities of color. It is not a coincidence that EBRPD’s parks with the most need fall within formerly redlined, urban zones.
Expanded access to well-maintained parks and green spaces in these areas could be transformative — but they must be prioritized. As EBRPD plans future investments, we urge them to partner with community-based developers already leading this work — like Ninth Root, whose community-led Damon Marsh shoreline project is 30% designed and located in a high-need East Oakland hotspot along the MLK Shoreline.
The Grass Can be Greener
While legislation intended to strengthen local parks moves slowly, it’s important not to give up hope.
Take Measure P, a local sales tax in Fresno approved by voters in 2018 to improve parks, recreation programs, and access to the arts. By adding a ⅜-cent sales tax, the measure is set to generate in roughly $37.5 million every year for the next 30 years — funding park maintenance, arts and cultural activities, walking and biking path improvements, the development of new recreational spaces, and more. Half of this funding is directed to underserved neighborhoods with fewer parks and higher rates of poverty or pollution. The city began administering funds in 2024, and local groups are now receiving grants to bring programs to Fresno residents.
In the East Bay, voters approved parcel taxes (Measure CC and later Measure FF) in 2004 that generate millions each year for park maintenance, wildfire prevention, habitat restoration, and facility repairs in parks. This steady revenue stream helps ensure parks stay clean, open, and safe — especially in densely populated and fire-prone communities.
At the state level, California’s Proposition 68 has successfully funded new parks in communities that need them most — but it doesn’t cover the ongoing maintenance needed to keep those parks clean, safe, and usable. California has proven it can invest in building parks, but must now invest in maintaining them.
A Walk in the Park: Solutions Worth Doing
At Greenlining, we’re exploring state-level policy solutions that would finally address park maintenance funding. One idea: create a pollution impact fee on refineries — a fee of just $1–2 per barrel refined could generate $584 million annually. That’s enough to fully maintain and restore every critical urban park in California’s working-class communities.
This policy would fund parks in areas with the highest pollution burdens and lowest green space access — like East Oakland, East LA County, and South Stockton — improving health outcomes, climate resilience, and equity.
We’ve conducted over a dozen interviews with government officials, park equity specialists, and GTB community partners — all of whom agree on the need for consistent, long-term funding sources for safe, clean parks in their neighborhoods.
Looking ahead, the GTB team will continue working with advocates and community stakeholders to stress test new policy ideas that can make this a reality. It’s time to stop waiting for someone else’s park to get better and start investing in our own.


